Do solar panels work in Arizona heat?
Yes. Arizona heat costs a modern panel roughly 0.3% of output per degree C above 25C, and Phoenix still produces 1,767 kWh per kW-DC per year against 1,095 in Seattle. Here is the arithmetic.
In this article
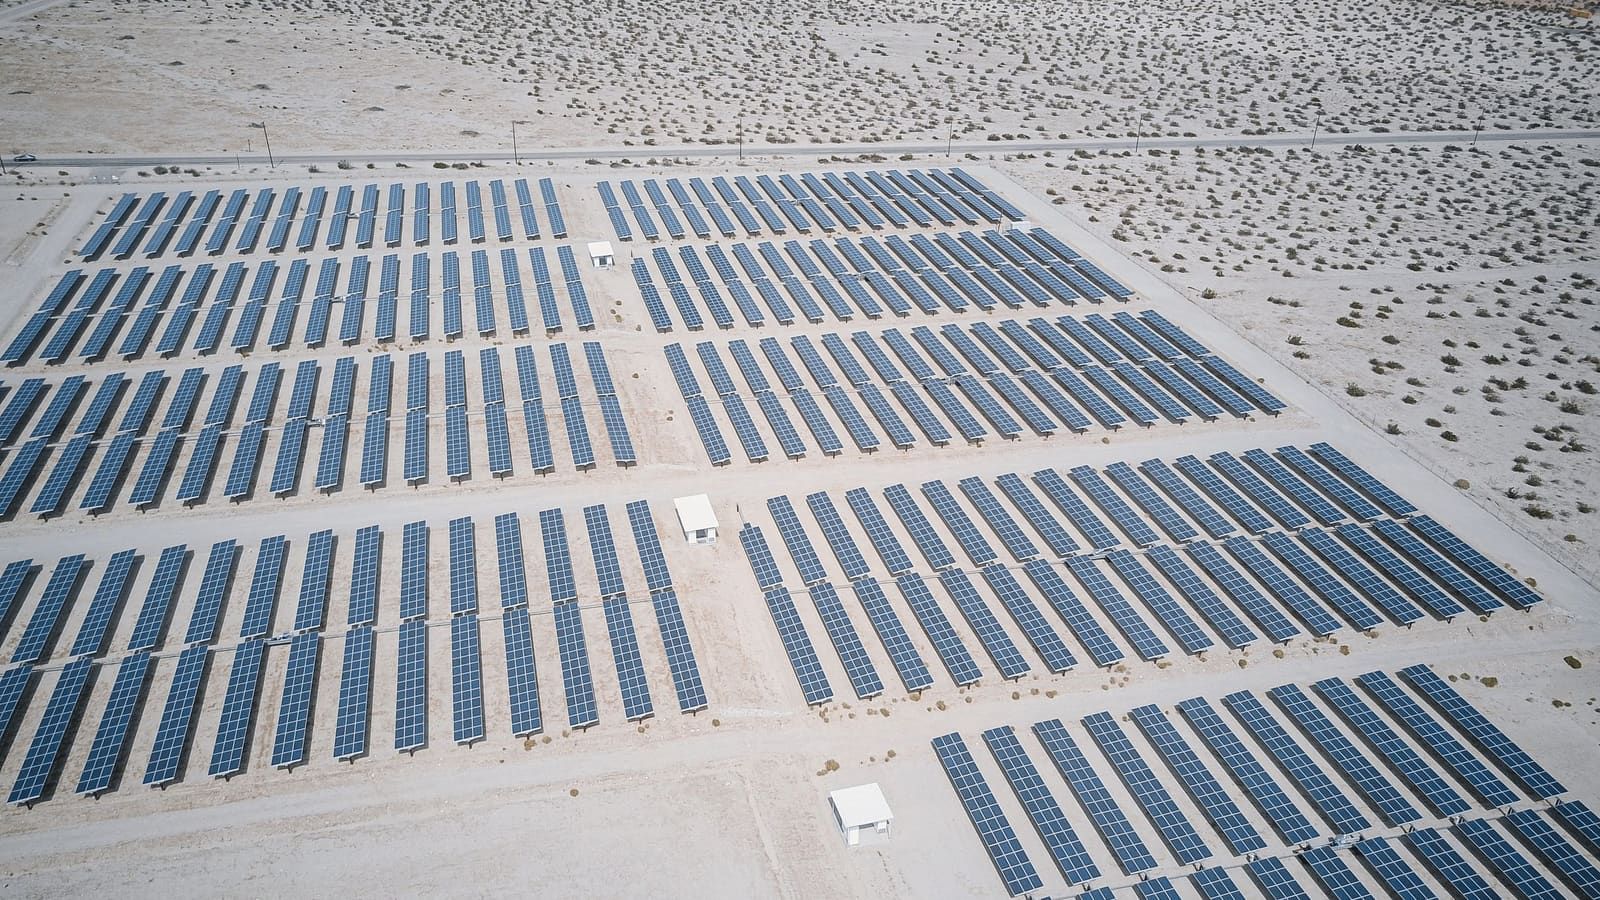
Solar panels work in Arizona heat, and they work better here than almost anywhere in the country. Heat does reduce output. A modern panel loses roughly 0.3 percent of its rated power for every degree Celsius its cells run above 25C. Phoenix still produces about 1,767 kWh per kW-DC per year, against 1,095 in Seattle.
The heat penalty is real and it is roughly a tenth the size of the sunlight advantage. Both halves of that sentence matter, and most articles only tell you one of them.
1,767 kWh
Annual output per kW-DC installed, Phoenix AZ
PVWatts v8, fixed open rack, 20 degree tilt, 180 azimuth, 14% system losses, tmy-2020.
61% more than Seattle at 1,095 kWh/kW
The short version
| Question | Answer |
|---|---|
| Does heat reduce solar panel output? | Yes, roughly 0.3% per degree C above 25C cell temperature |
| How hot do rooftop panels actually get? | Commonly 25 to 35C above ambient, sometimes more |
| Does Arizona still come out ahead? | By a wide margin. 1,767 vs 1,095 kWh/kW/yr against Seattle |
| Does heat shorten panel life? | It accelerates degradation, from about 0.5%/yr temperate to 0.88%/yr in hot climates |
| Do I need special panels? | No, but temperature coefficient and mounting airflow are worth checking |
The honest part: heat does trim output
Solar panels are rated under Standard Test Conditions: 1,000 W/m2 of irradiance, 25 degrees Celsius cell temperature, and an AM1.5 spectrum, per IEC 60904-3. A 400 W panel is a 400 W panel at 25C cell temperature. Above that, output falls.
How much it falls is the temperature coefficient of maximum power, published on every module datasheet. The commonly quoted range of “0.3 to 0.4 percent per degree C” is outdated on the high end. It described older p-type multicrystalline modules. Current n-type modules do better:
| Manufacturer and model | Technology | Pmax coefficient |
|---|---|---|
| REC Alpha Pure-RX | Heterojunction (HJT) | -0.24 %/C |
| JinkoSolar Tiger Neo N-type 72HL4-BDV | N-type TOPCon | -0.29 %/C |
| Qcells Q.TRON BLK M-G2+ | N-type TOPCon | -0.30 %/K |
Roughly -0.3 percent per degree C is the right figure for a mainstream module today, with the best heterojunction panels near -0.24. If a quote lists a module at -0.4 percent per degree C, that is a meaningfully worse panel for this climate and worth asking about.
How hot does a rooftop panel actually get?
Much hotter than the air. Datasheets publish a figure called NOCT or NMOT, measured at 800 W/m2, 20C ambient and 1 m/s wind with an open back. Typical values are 43 to 45C, meaning the module sits roughly 23 to 25C above ambient under those mild reference conditions.
Real rooftops in August are not mild reference conditions. Two published models bracket the range:
- The PVWatts v5 technical manual (opens in a new tab) uses an installed nominal operating cell temperature of about 49C for roof mounts with 4-inch standoffs, against 45C for open rack. Scaled from the 800 W/m2 reference to full sun, that implies roughly 36C above ambient for a roof mount.
- The Sandia module temperature model (opens in a new tab) with close-roof-mount coefficients yields roughly 48C above ambient at 1,000 W/m2 and 1 m/s wind.
A reasonable rule of thumb is 25 to 35C above ambient, with tight-to-the-roof mounting in still air pushing well past 40C. Nobody should quote a single number as fact here; it depends on mounting, wind and module construction.
The worked example
Take a genuinely brutal Phoenix afternoon. Air temperature 45C (113F). Module running 35C above ambient, so a cell temperature of 80C. Temperature coefficient -0.30 %/C.
Cell temperature above rating: 80C - 25C = 55C
Output loss: 55 x 0.30% = 16.5%
So on the worst hour of the worst day, a 400 W panel is producing roughly 334 W rather than 400 W. That is a real loss and it is not trivial.
Now the correction most articles skip. That 16.5 percent figure applies to a handful of hours, not to the year. Annual production models like PVWatts already include the temperature derate across every hour of a typical meteorological year, and the Phoenix result they produce, 1,767 kWh per kW-DC, is a post-derate number. The heat penalty is already inside it.
Why Arizona still wins, by a lot
The comparison below runs identical assumptions through PVWatts v8 for four cities: 1 kW-DC, fixed open rack, standard module, 14 percent system losses, 20 degree tilt, 180 degree azimuth, tmy-2020 weather data.
Annual solar output per kW-DC installed, by city
Modelled annual production in kilowatt-hours per kilowatt of DC capacity, under identical system assumptions. Temperature derate is already included in every figure.
View the numbers as a table
| City | Value ( kWh) |
|---|---|
| Phoenix | 1767 kWh |
| Boston | 1312 kWh |
| Chicago | 1308 kWh |
| Seattle | 1095 kWh |
Source: PVWatts v8 (NLR), 1 kW-DC fixed open rack, standard module, 14% losses, 20 degree tilt, 180 azimuth, tmy-2020.
Phoenix produces 1.61 times what Seattle produces and 1.35 times what Chicago or Boston produce, from the same hardware, after the heat penalty has been applied.
The underlying resource explains why. Phoenix sees a plane-of-array irradiance of 6.51 kWh/m2/day under those assumptions, against 4.66 in Boston, 4.47 in Chicago and 3.92 in Seattle. Capacity factor runs 20.17 percent in Phoenix against 12.50 percent in Seattle.
Put plainly: the heat costs single-digit percentages across a year, and the sunlight advantage is worth 35 to 61 percent. The net is strongly positive, which is why so many Arizona roofs pencil out.
For context on how much heat Arizona actually delivers, NOAA’s 1991 to 2020 climate normals for Phoenix Sky Harbor put the average July high at 106.1F and the average number of days per year at or above 100F at 103.3.
Will Arizona heat wear my panels out faster?
Yes, measurably. Median module degradation runs about 0.5 percent per year in temperate climates and about 0.88 percent per year in hotter ones, per NLR analysis. Over 25 years that difference compounds to roughly 9 percentage points of remaining output.
This is the part of the heat question that gets the least attention and deserves the most.
The foundational work is Jordan and Kurtz’s degradation-rate meta-study (opens in a new tab), which examined nearly 2,000 reported degradation rates and found a median of 0.5 percent per year, a mean of 0.8 percent, with 78 percent of observations below 1 percent per year.
A more recent NLR fleet analysis (opens in a new tab) covering roughly 1,700 systems and 8.5 GW reports median system degradation of -0.75 percent per year, and quotes climate-dependent differences “ranging from -0.5%/yr in temperate zones to 0.88%/yr in hotter areas.”
The mechanism is documented too. In desert climates, short-circuit current degrades faster than maximum power, which is attributed to EVA encapsulant browning under sustained high temperature.
Modelled remaining output after 25 years, temperate vs hot climate
Compounded module degradation at 0.5% per year and 0.88% per year, applied to a nominal 100% starting output. Illustrative arithmetic, not a warranty figure.
View the numbers as a table
| Category | Temperate, 0.5%/yr (%) | Hot climate, 0.88%/yr (%) |
|---|---|---|
| Year 10 | 95.1% | 91.5% |
| Year 20 | 90.5% | 83.8% |
| Year 25 | 88.2% | 80.2% |
Illustrative compounding of NLR-reported degradation rates. Actual output depends on the specific module and site.
That chart is arithmetic on published rates, not a measurement of any particular system. Treat it as a sense of scale.
Warranty terms have also moved, and “25-year performance warranty” is no longer a single standard:
| Module | Product warranty | Performance term | Year 1 | Annual | End of term |
|---|---|---|---|---|---|
| Qcells Q.TRON BLK M-G2+ | 25 yr | 25 yr | 98.5% | 0.33% | 90.58% at yr 25 |
| REC Alpha Pure-RX | 20 to 25 yr | 25 yr | 98% | 0.25% | 92% at yr 25 |
| JinkoSolar Tiger Neo 72HL4-BDV | 12 yr | 30 yr | 99% | 0.40% | 87.4% at yr 30 |
Note that the Jinko module carries a longer performance term but a shorter product warranty, and a faster guaranteed decline. These are not interchangeable numbers, and in a hot climate the guaranteed annual decline rate is the one to compare.
What to check on a system designed for desert heat
Given everything above, four specifications carry more weight in Arizona than they would in a mild climate.
Temperature coefficient of Pmax. Lower is better. Anything at or below -0.30 %/C is reasonable; -0.24 %/C is excellent. This is a datasheet number, so it can be verified before anything is signed.
Guaranteed annual degradation rate. Given the 0.5 versus 0.88 percent per year climate spread, the warranted decline rate is a more meaningful comparison here than the headline warranty term.
Standoff height and airflow under the array. Module temperature is driven substantially by how much air can move behind the panel. The PVWatts model itself distinguishes roof-mount from open-rack thermal behaviour by several degrees.
Inverter operating temperature range. Inverters are electronics in an outdoor enclosure in a place that reaches 115F. Their rated operating range and derating behaviour at high ambient temperature matters as much as the modules’.
None of these require exotic equipment. They require reading the datasheets.
Common questions
Does Arizona heat reduce solar panel output?
Yes, by roughly 0.3 percent for every degree Celsius the cells run above their 25C rating. On a genuinely extreme afternoon, with cells at 80C, that works out to about 16.5 percent below rated output.
Across a full year the effect is much smaller, because most hours are not extreme. Annual production models like PVWatts already include the derate, and Phoenix still returns about 1,767 kWh per kW-DC per year after it has been applied.
If heat hurts panels, why is Arizona good for solar?
Because the sunlight advantage is roughly ten times larger than the heat penalty. Under identical modelled assumptions, Phoenix produces 1,767 kWh per kW-DC per year against 1,095 in Seattle, 1,308 in Chicago and 1,312 in Boston.
Phoenix sees plane-of-array irradiance of 6.51 kWh/m2/day against Seattle’s 3.92, and runs a 20.17 percent capacity factor against Seattle’s 12.50 percent. Those figures are post-derate.
Will Arizona heat wear my panels out faster?
Somewhat. NLR analysis reports climate-dependent degradation ranging from about 0.5 percent per year in temperate zones to 0.88 percent per year in hotter areas. Compounded over 25 years, that is roughly 88 percent versus 80 percent of original output remaining.
The documented mechanism in desert climates is EVA encapsulant browning under sustained heat, which shows up as short-circuit current degrading faster than maximum power. Comparing warranted annual decline rates between modules is more useful here than comparing warranty terms.
Do I need special panels for the desert?
Not exotic ones, but four specifications matter more here: the Pmax temperature coefficient, the guaranteed annual degradation rate, standoff height for airflow under the array, and the inverter’s high-ambient operating range.
All four are datasheet figures that can be compared before anything is committed. Nothing on that list requires a premium product line, only reading the specifications rather than the brochure.
How hot do solar panels get in Phoenix?
Considerably hotter than the air. Datasheet NOCT and NMOT values, measured at a mild 20C ambient, already put modules at 43 to 45C. Under full sun the module runs commonly 25 to 35C above ambient, and tight-to-the-roof mounting in still air can push past 40C.
On a 113F (45C) Phoenix afternoon, that puts cell temperature somewhere in the region of 70 to 85C. The exact figure depends on mounting, wind and module construction, which is why no single number should be quoted as fact.
The bottom line for an Arizona homeowner
Heat is a real but secondary factor, and it is already priced into every credible production estimate. The reason to look at solar in Arizona has not changed: exceptional sunlight and a utility bill that keeps climbing.
The variables that actually decide the outcome are the rate plan you are on, what the utility pays for exported energy, and how much of your own production you can consume rather than export. Those are covered in is solar worth it in Arizona, APS rate plans explained and APS solar buyback rates explained.
Related reading
- Is solar worth it in Arizona? runs the full payback arithmetic against current Arizona rates.
- Arizona solar incentives and tax credits covers what remains after the federal credit ended.
- APS solar buyback rates explained covers why self-consumption is worth more than exporting.
- Solar plus battery in Arizona covers whether storage changes that calculation.
Output, degradation and climate figures were verified against PVWatts v8, NLR publications, manufacturer datasheets and NOAA climate normals on August 10, 2026. Modelled figures use stated assumptions and are not a prediction for any specific roof.
- Solar Basics
- Arizona
More on Solar Basics
Solar payback period in Arizona: how long until they pay for themselves
On 2026 numbers, simple payback in Arizona runs about 10 to 24 years. The spread comes from installed cost and self-consumption share, not sunshine. Here is the arithmetic, the sensitivities, and what simple payback leaves out.
Is solar worth it in Arizona? What the real numbers show
Arizona pays 14.91 cents per kWh, below the national average, but uses 25% more power. With the federal credit gone, payback now hinges on how much solar you use yourself rather than export. Here is the arithmetic.
Solar plus battery in Arizona: is it worth it?
Whether a home battery pays in Arizona depends on your utility, not the hardware. The APS export gap, SRP's $36.05/kW summer demand charge, current installed costs, and the federal credit that no longer exists.