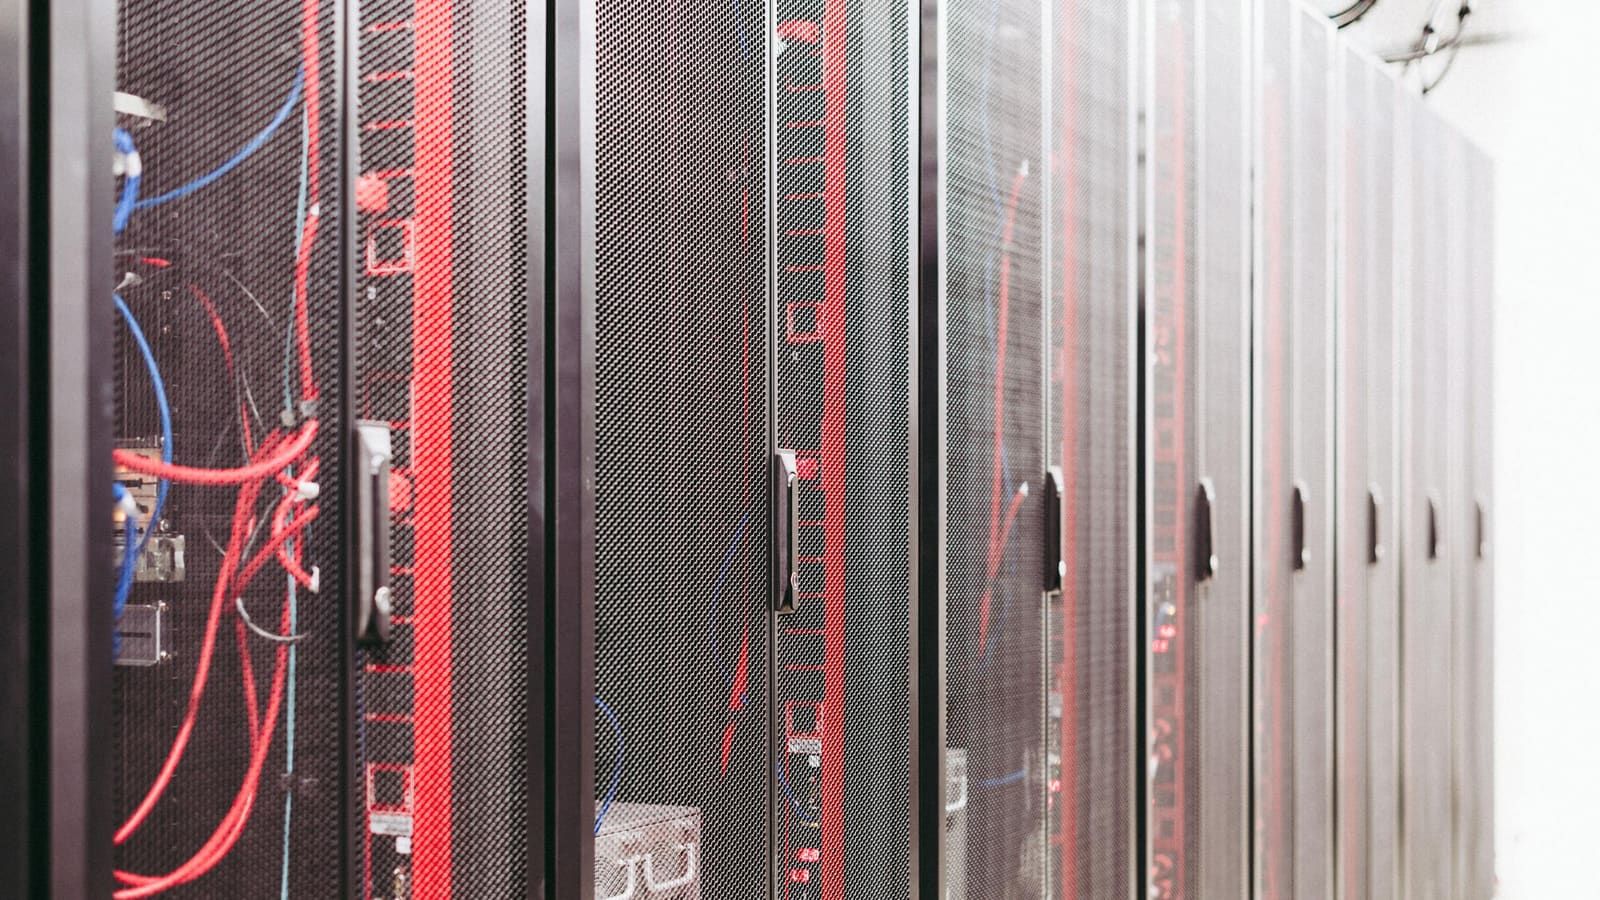
Short answer: Arizona's data-center boom collides with two scarce desert resources: power and water. Metro Phoenix hosts about 707 MW of operating data-center capacity that runs around the clock and uses water for cooling, a leading reason Arizona electricity demand is growing about four times the national rate. That feeds into the grid costs landing on your bill.
The scale of the buildout
Metro Phoenix now hosts about 707 MW of operating data-center capacity, more than any major U.S. metro except Dallas, with roughly 140 facilities running and dozens more planned (Metro Phoenix Alliance, DataCenterMap). Microsoft, Google, Meta, Apple, and NTT are all here, and proposals keep getting bigger. Because these facilities run servers nonstop, they draw power continuously, which is a big reason Arizona's electricity demand is growing roughly four times the national rate.
The water question
Power is only half of it. Many data centers use water to cool their equipment, and in a desert state already managing tight water supplies, that draws understandable concern (The Upper Middle, AZ Public Health Association). A fair note: actual water use varies widely by facility and cooling design, and the numbers are debated, so treat any single dramatic figure with caution. The honest version is that energy and water demand together are why the boom gets the scrutiny it does.
Why Arizona, and why the tension
Arizona drew the industry with cheap land, low disaster risk, tax incentives, established fiber, and power that used to be inexpensive. Those same advantages are now in tension with the strain the facilities place on the grid and on water. The state is actively debating how to manage future growth, including at the Arizona Corporation Commission's large-load workshop in April 2026 (ACC).
What it means for homeowners
The connection to your bill is indirect but real. The buildout drives demand, demand drives grid investment, and that investment flows into rate cases. Whether large loads carry their fair share of those costs is the open fight, covered in are data centers raising Arizona electric bills, and the broader picture is in why your Arizona electric bill keeps going up.
None of this is something a single homeowner can change. What you can do is reduce how dependent you are on a grid under this much pressure. Owning solar fixes the cost of the power you generate, and the Arizona sun makes that work well here. If you want to see the numbers for your own roof, the savings calculator is a no-strings starting point.
Common questions
How much power do Arizona data centers use?
Metro Phoenix hosts about 707 MW of operating data-center capacity, more than any major U.S. metro except Dallas, with roughly 140 facilities and dozens more planned. These run around the clock, so they pull power day and night. Data centers are a leading reason Arizona electricity demand is growing about four times the national rate.
Do data centers use a lot of water in Arizona?
Many data centers use water for cooling, which draws public concern in a desert state already managing tight water supplies. The exact water use varies a lot by facility and cooling design, and figures are debated, so be cautious with any single dramatic number. The fair statement is that water and energy demand together are why the boom draws scrutiny here.
Why is Arizona attractive to data centers?
Cheap land, low natural-disaster risk, tax incentives, established fiber networks, and power that used to be inexpensive. Those same incentives are now in tension with the strain the facilities put on the grid and on water, which is why the state is debating how to manage future growth.
What does any of this mean for me as a homeowner?
Indirectly, a lot. The buildout drives demand growth, which drives grid investment, which flows into rate cases. Whether large loads pay their fair share of that is being decided at the Arizona Corporation Commission. Meanwhile your bill keeps arriving, which is why owning your own power generation is worth a look.
This is a general overview of a fast-moving topic; capacity, water, and policy figures change over time. We have flagged where numbers are debated rather than dressing them up.